Nitrogen Insights Monitor
Transform your nitrogen practices with our advanced monitor
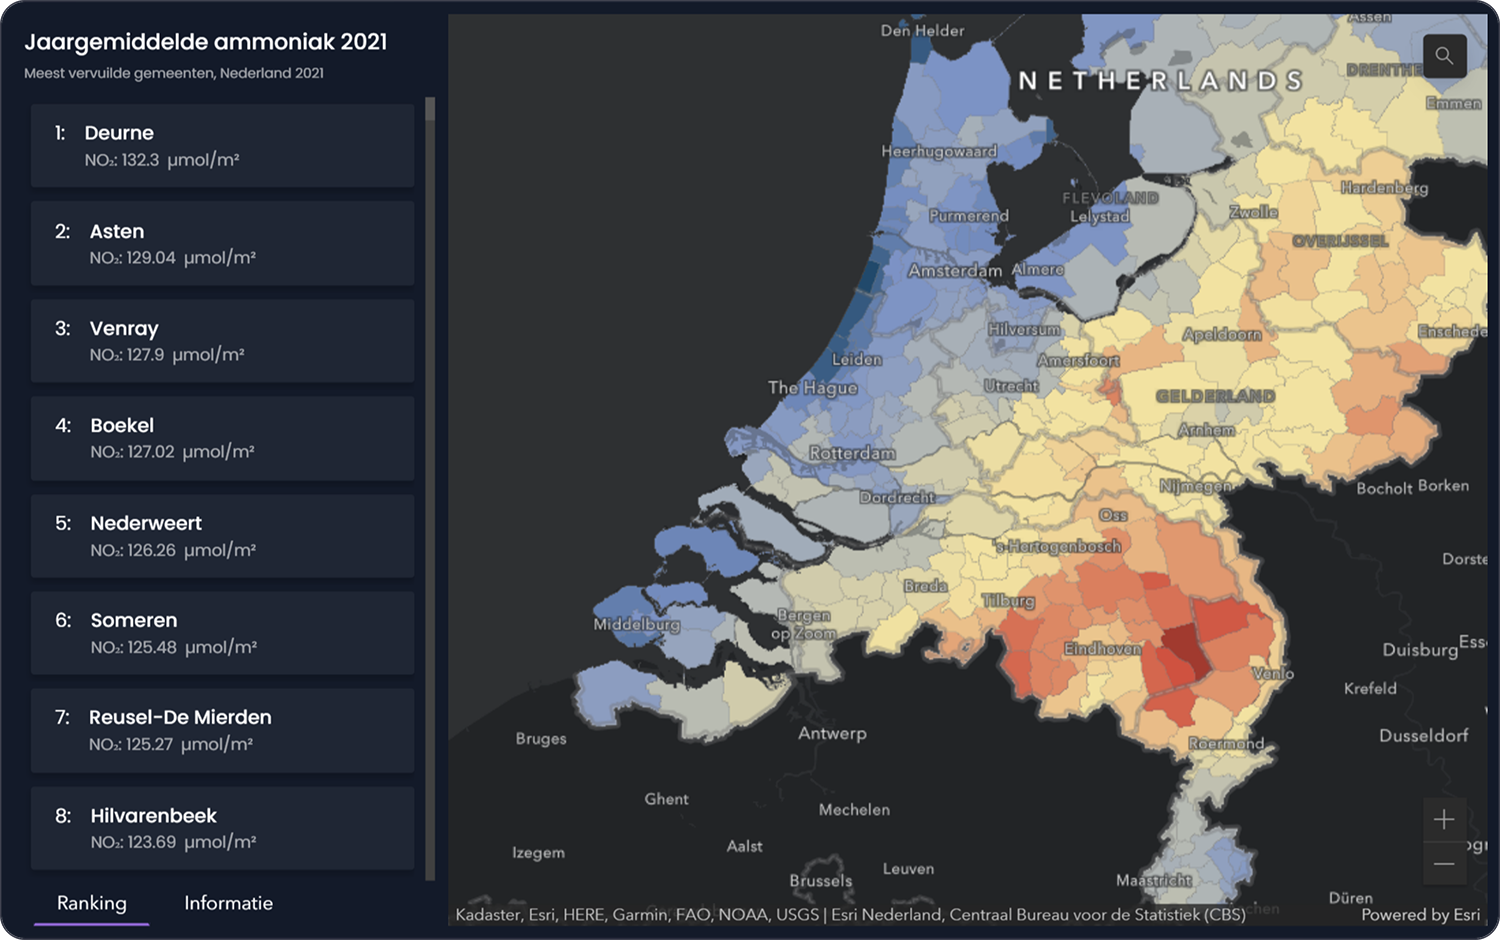
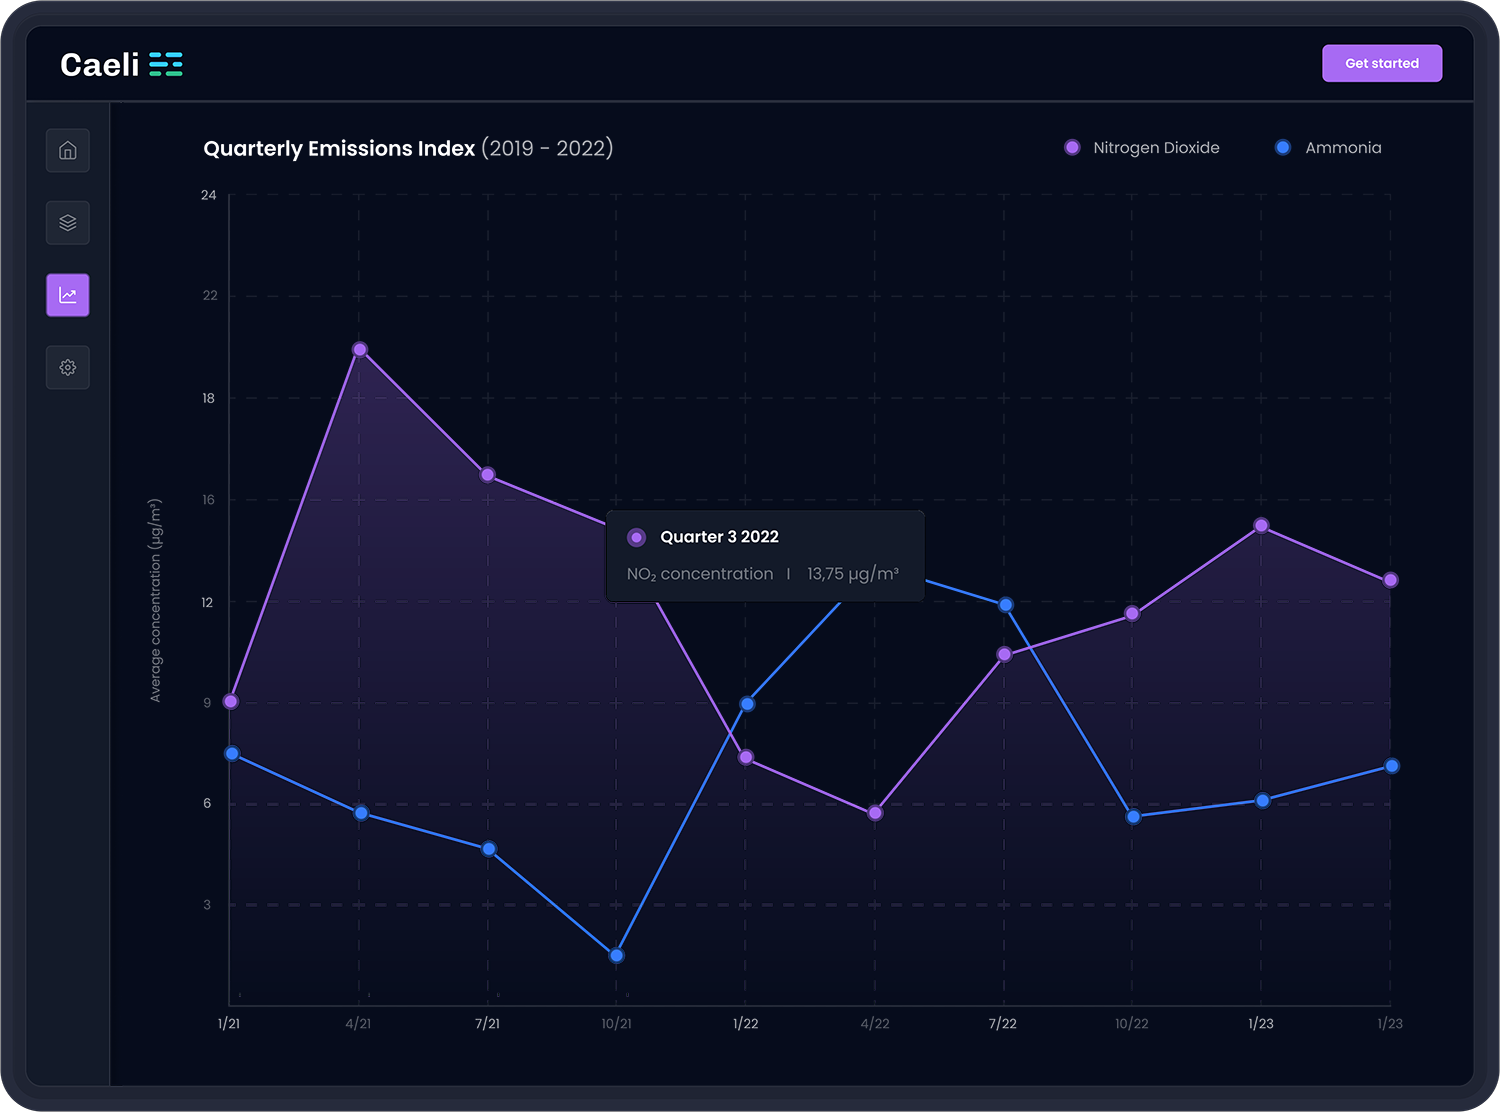
Our product allows you to easily visualize and track nitrogen dioxide and ammonia levels. With this tool, you can optimize your nitrogen management and reduce emissions.
Data package
We provide you with our data in CSV and TIFF formats to get started right away.
Accessible dashboard
Access your data anytime, anywhere. Your own online dashboard, filled with maps and charts.
Documentation
Receive a report with explanation of our findings. Including maps and graphs for the right insights.
Lifecycle of air pollution
Emissions to deposition
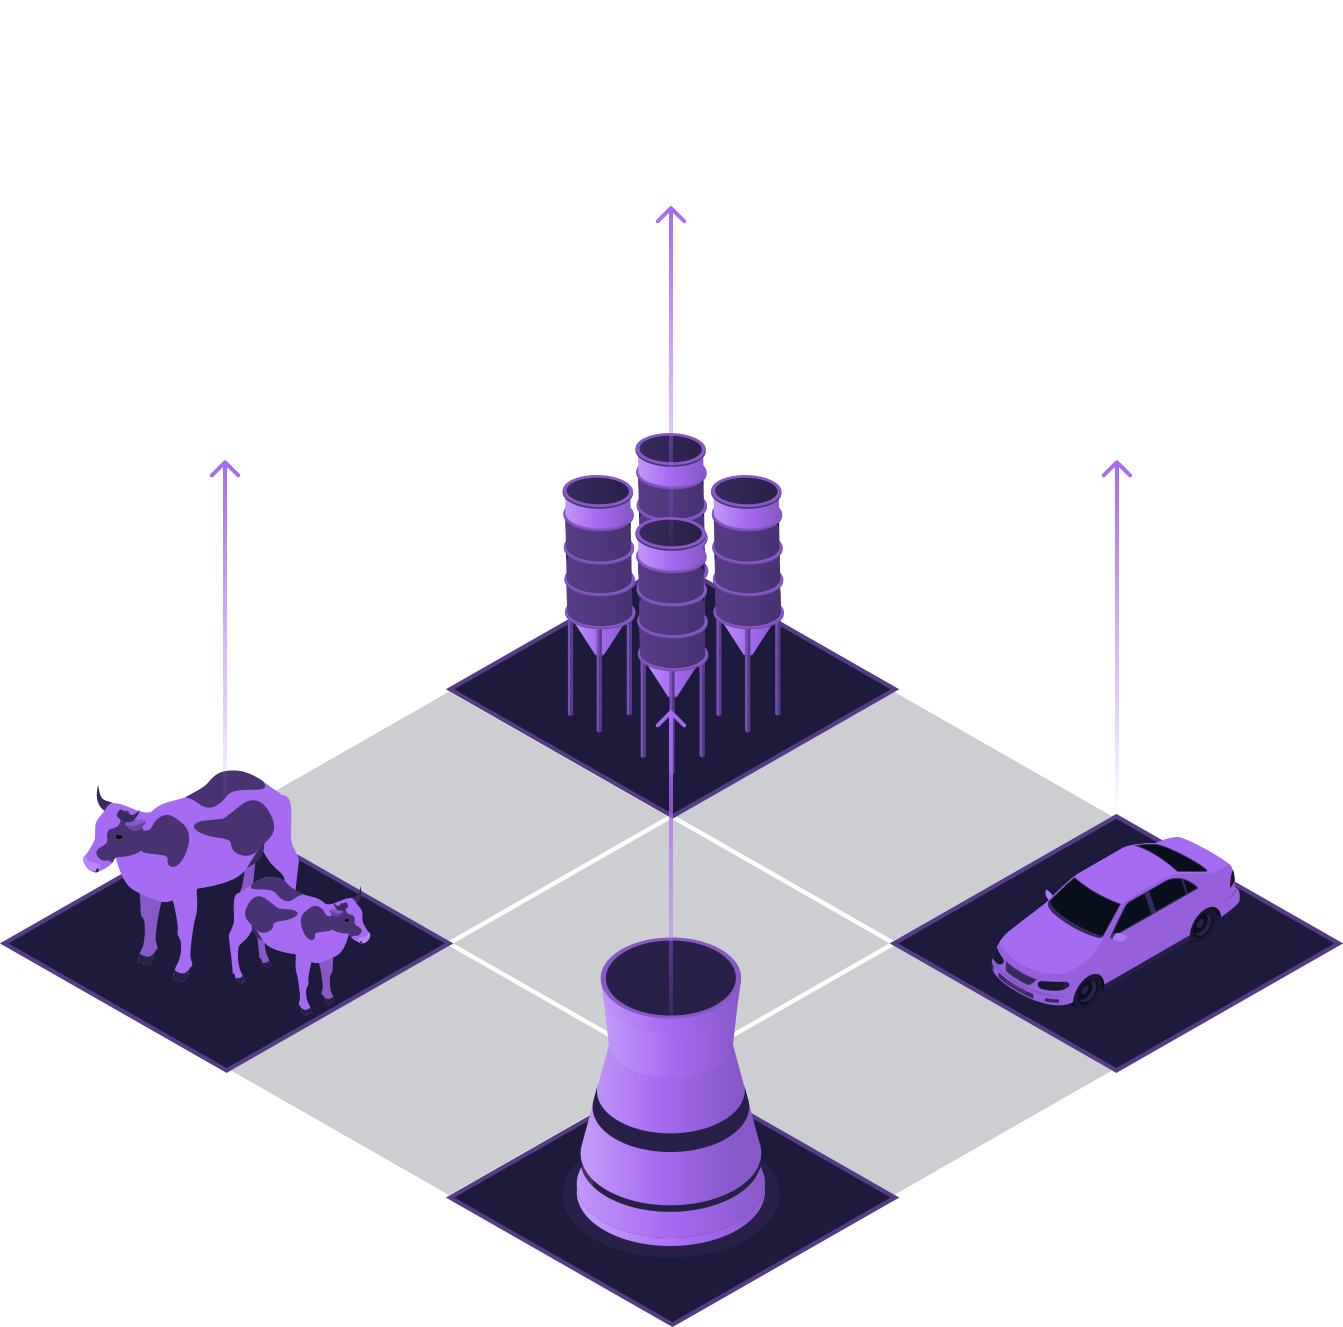
Emission
Emission refers to the release of pollutants into the atmosphere, from factories, cars and other sources.
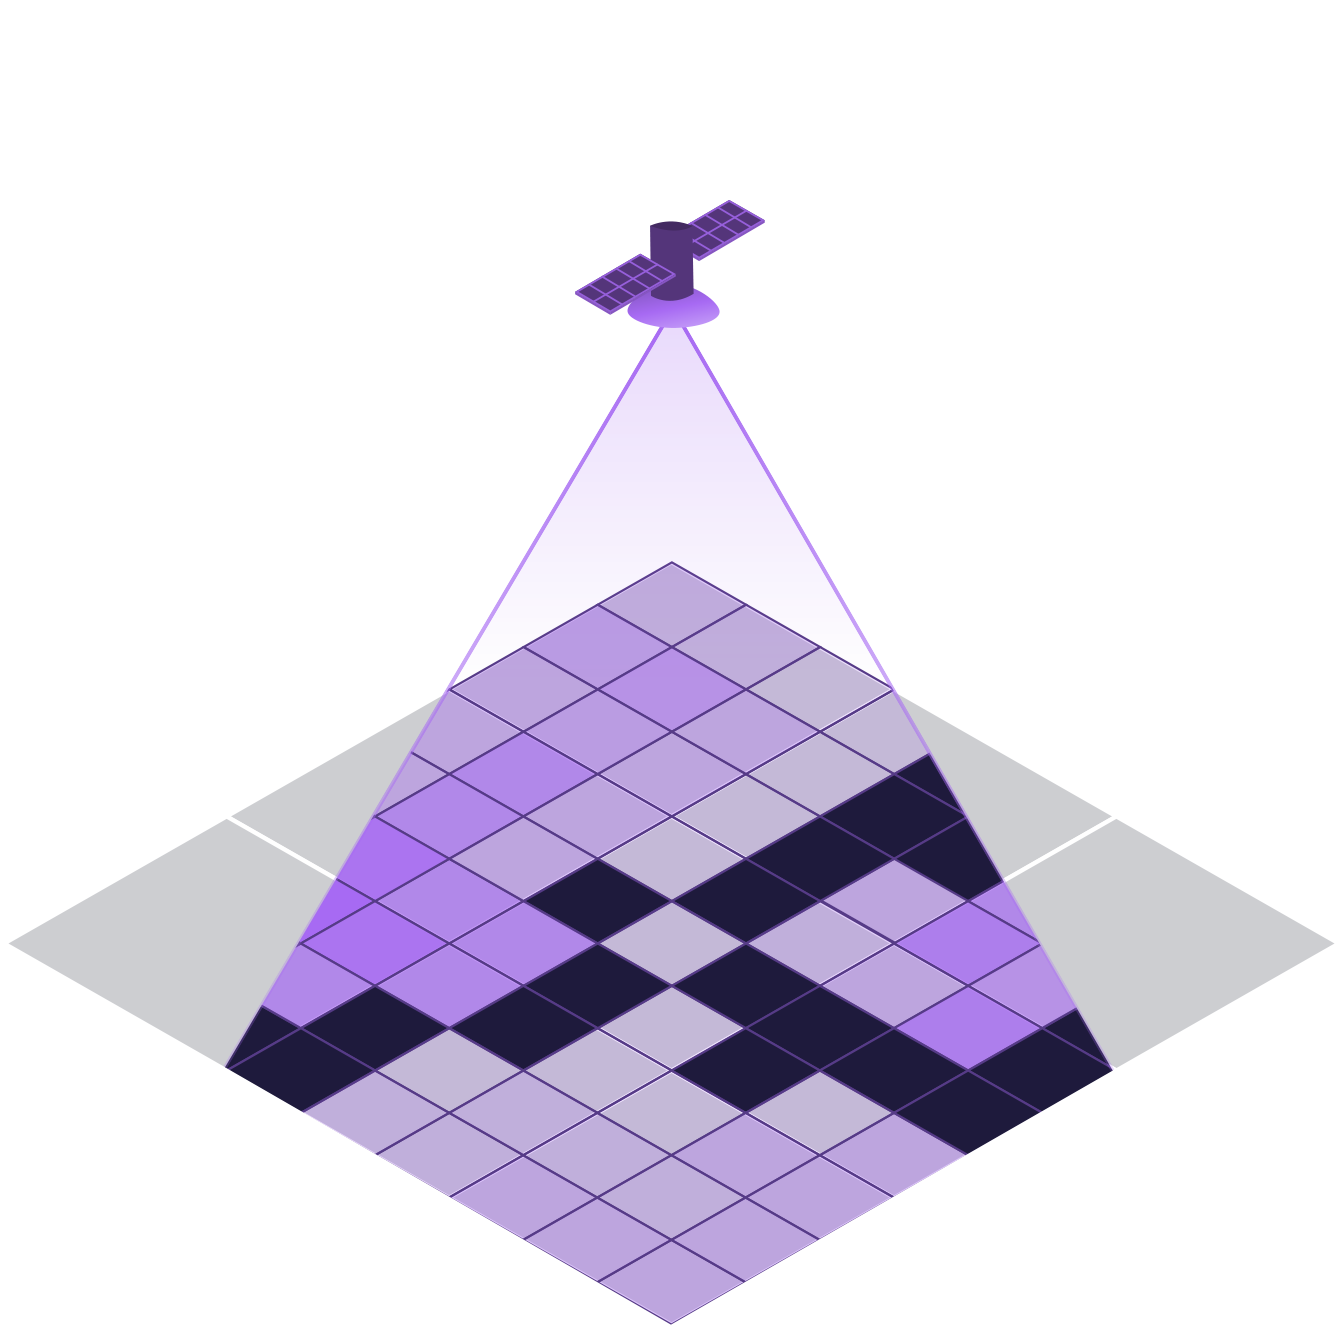
Concentration
Concentration refers to the amount of pollutants present in the air at a given location and time.
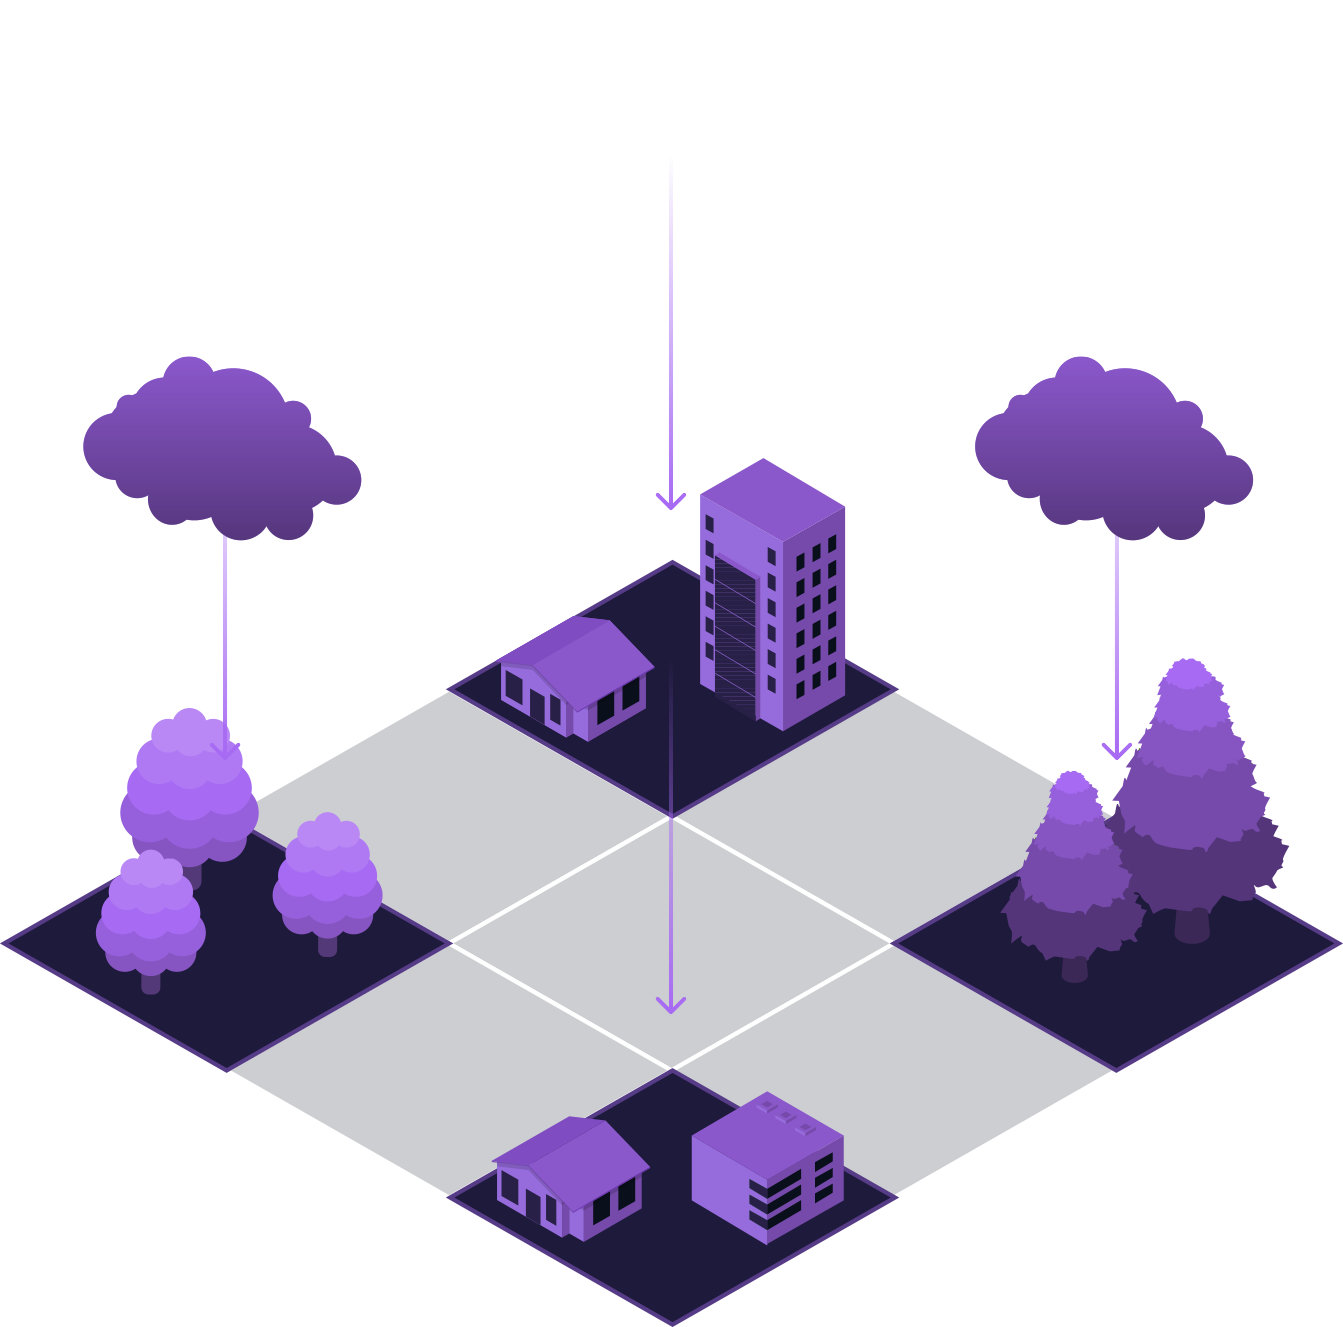
Deposition
Deposition refers to pollutants that settle on the Earth’s surface. Through rain or snow (wet deposition) or direct (dry deposition).
From column to surface
Bringing accurate nitrogen pollution data into focus
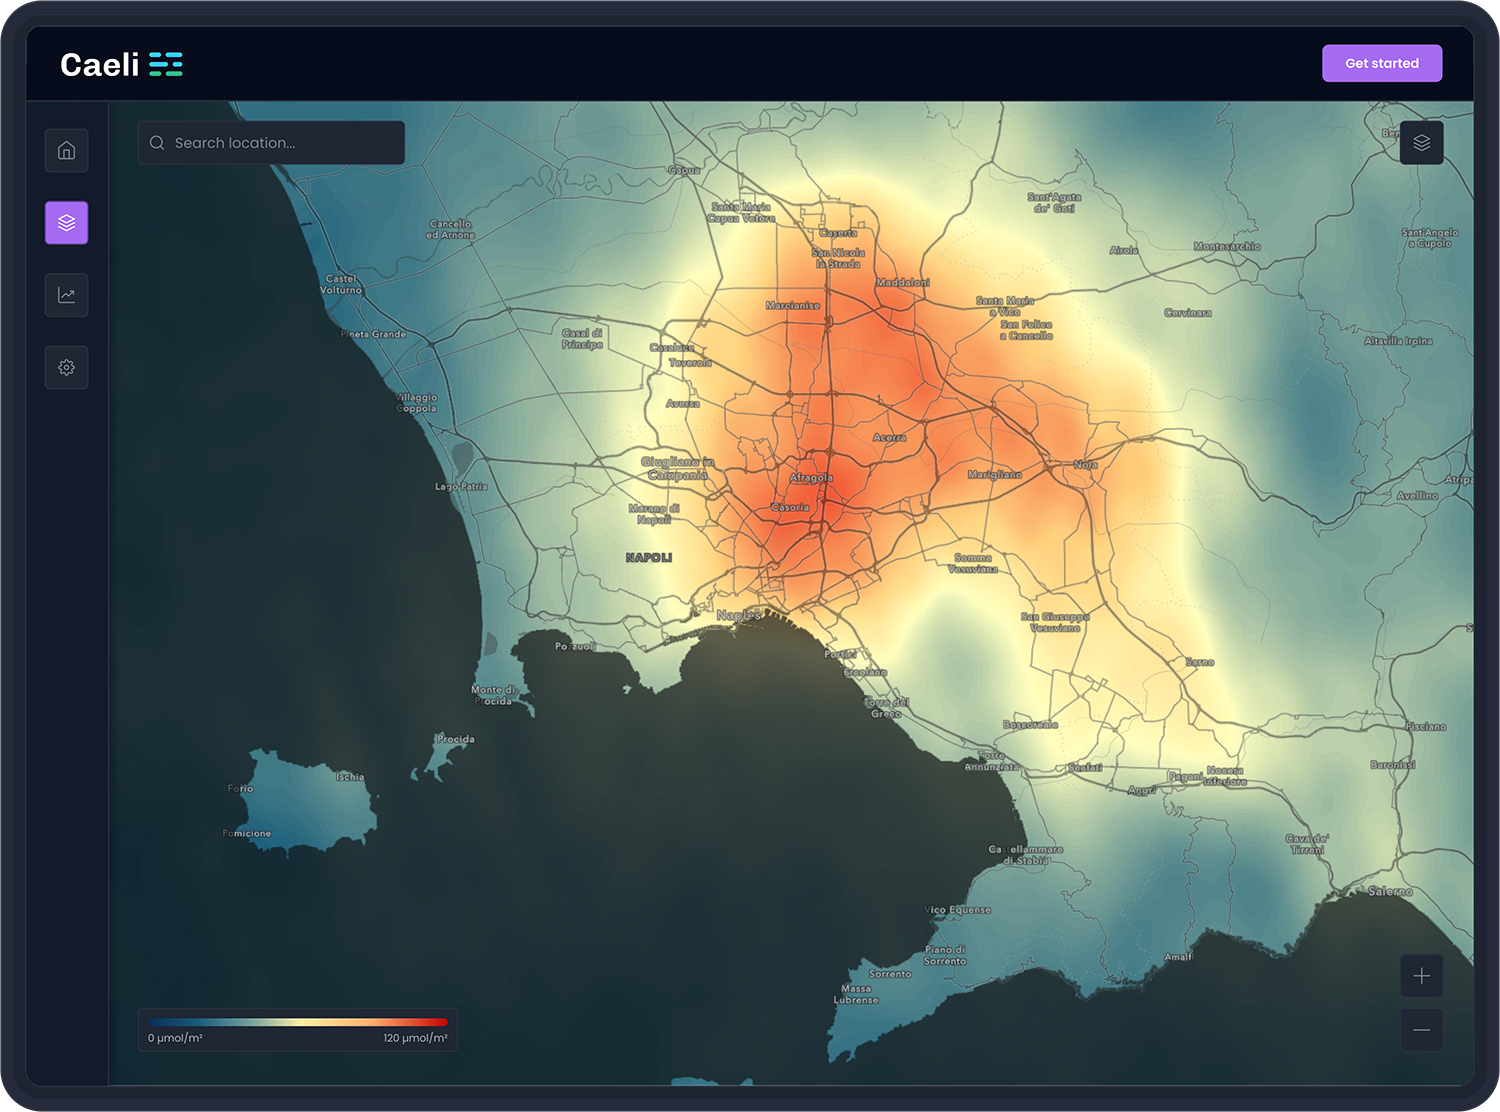
To ensure accurate monitoring of pollutant impacts on human health and the environment, it is crucial to convert satellite measurements from column-level to surface-level data. By adopting this approach, we can effectively track pollutant concentrations at the surface level.
- Accurate measurement of pollutants at surface level
- Identification of high-pollution areas
- Targeted pollution reduction efforts
Visualize to optimize
Visualizing emissions for targeted reduction
The nitrogen insights monitor helps target NO2 and NH3 emissions per region, aiding a region-specific approach to tackle nitrogen-related issues and protect human and environmental health.
- Enables targeted approach to emissions
- Supports region-specific solutions
- Protects human and environmental health
Interested in our monitor?
Interested in our Nitrogen Insights Monitor? Fill out the contact form and our team will get in touch with you soon.